Monday, November 20, 2023

Not Strictly Funtional

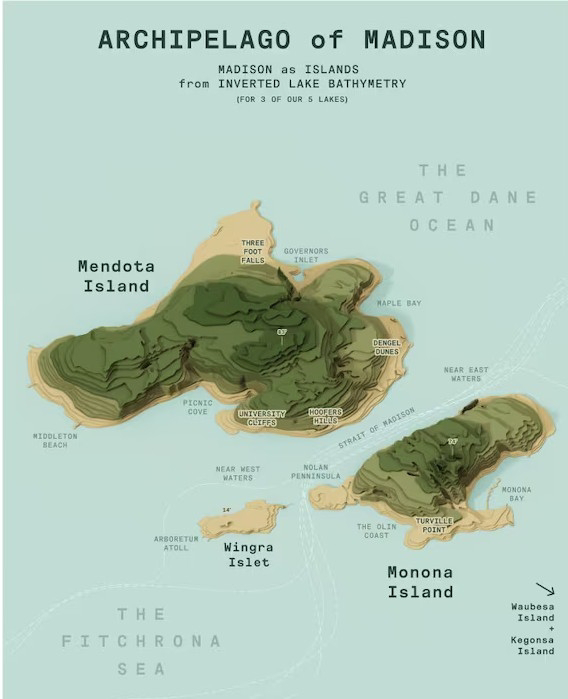
 It's been awhile, but I recently came across a mapping approach that serves art as much as data visualization. Steven Kennedy of Madison, Wisconsin, turns map data on its head to alter our perception of the world. For example, he turned Madison lakes bathymetry into elevation, mapping the result as 3D islands in the surrounding county sea.

                     latlong shop

In another map, Kennedy overlays Madison area bike trails with a diagram of the solar system. 

Who thinks of this stuff? On the other hand, have you ever tried to visualize the timeline of biological evolution? You need something familiar to compare it to at more of a human scale. With Kennedy's map, Mars is just a short jaunt along Lake Mendota's shore, whereas Pluto is a good day's ride through the southern Wisconsin countryside to the small village of Mt. Horeb.

Check out the rest of Kennedy's fanciful maps at his Web site:  latlong.shop. I think you will agree that data is more than just facts and figures. There is whimsy and art and if you turn your head and squint your eyes, you can see a whole other world.

Wednesday, July 25, 2012

Social Mapping

New on http://horizonmapping.net: examples of Social Mapping. Go to Maps and click on the Social Mapping map icon. The gallery is built using the Joomla Content Management System. When a visitor clicks on a map marker, a tooltip opens displaying a member's name and a link to one or more of their social networking profiles. These applications are another way for conference attendees, website users or contributors to connect with one another and to further the goals of organizations.

Thursday, October 28, 2010

Clouds are free, rainbows are extra

Sorry about that. I got distracted by life. I know you all were waiting for part two of "Power to the People". By all, I mean you, guy, with your cardboard hat, eating snickerdoodles on your bean bag chair, while Looney Tunes plays on the set. Now, where was I... Oh, yes, I was talking about how to do more with fewer resources.

As long as you dont mind putting up with a few ad boxes on your web site, or occasional down time, you can have a fully featured web presence without paying for the whole kit and kaboodle. The idea is that there are sources of digital data being streamed onto the web and you dont have to pay to access them. The current catch phrase for this digital ocean of data is the cloud.

You may have heard that an unnamed megalosaurus of a software company (if I just said Microsoft what fun would that be) is offering you a world of wondrous things in "The Cloud". And yes, it is probably all true, only dont confuse "The Cloud" with the cloud. "The Cloud" will cost you greenbacks, the cloud will cost nothing, except an occasional mind blank of ads on the periphery.

Ok, you say, now he's just ranting. So you want details. It starts getting technical here, so dont say I didnt warn you (dont you just hate apostrophes).  A stream of data in the cloud is called a web service. Everyone has agreed what a service is, so anyone can build an app to access services without a separate config for each one. What does that mean, you ask? OpenLayers is a javascript tool that lets you build a map on your site from bits and pieces of geographic data floating around in the cloud. You can add your own information to it if you want, but even that can be stored in another cloud member, an api called Google Docs. You can combine Google Docs with Google Maps (another "free" cloudite) and roll your own web map without building out your server infrastructure (see Seattle Green Map).

On top of this cloud ocean (rather than mixing metaphors again, I decided to combine them), are floating some pretty sophisticated drilling rigs. These middleware tools pull up filtered data from the ether and present it in your web site - and you dont have to pay one red cent. In the biz, we call that opensource. While these are still in their infancy, you can still have fun without paying up front. One promising data rig is GeoCommons. I built a


prototype

for one project from my own shapefile which I uploaded and from another GC layer from someone else, all overlayed on a free base layer from OpenStreetMap.

I know, not the speed you expect from the web these days, and just to warn you, some stuff just doesnt work. But as I said, we are talking about the birth of a new way of doing things, so check back in a little while. A very, little while.
Saturday, September 11, 2010

Power to the People


Back from Acadia in Maine, where earth meets sky meets sea, and where I was without my usual digital trappings. Instead I took a Boost pay as you go Android phone on which I could read emails, respond if necessary, but not do any other useful work
.

This got me thinking about information: accessing it, contributing it, and managing it. The end of last century saw the rapid rise and spread of personal computers and the internet throughout the developed world. Behind the scenes, the amount of digital information available online exploded. Adding to this, Web 2.0 interaction lead to a tidal wave of data being collected from users.

Fast forward to the 21st century. Two innovations have brought the information age to all. Mobile and the costless cloud (the what?). Who knew that the drive to provide newer, smaller, wireless devices to an insatiable digital society would produce something almost everyone in the world could afford - the mobile phone and WAP browser.

At first sight, the wap browser does not appear that functional, if you have the luxury of a PC or smart phone browser. The important thing, though, is that it allows you to be connected, and if that is all you've got, it's a great thing. Three examples of what you can do with mobile to bring information to the masses are EpiSurveyor, the Global Fire Management System, and Kiva. And, in yet another self-serving reference, the UshLo mobile site allows users to query the Ushahidi crisis crowdsourcing database for reports by date, category, and/or location. It is designed to work from most internet enabled devices, including pc's, smart phones, and phones with wap browser capability.

The next post to this blog will explain what I mean by the "costless cloud". In general, it means that developers don't have to maintain a complete server infrastructure to manage and publish digital data online.

Saturday, August 21, 2010

Cherish What Remains

Sea Cliffs, CA
Sea Cliffs, CA
The sea ebbs and flows, removing stone from the matrix of the earth. What remains are empty spaces and sometimes the arches over them. These beautiful remnants are admired by those who view them.


 Think of the sea as being over-consumption and think of the earth as being... well, the earth, then that which remains after resource depletion are wonderful fragments we should cherish.

 If we measure them and map their dimensions then we will recognize them elsewhere and find ways to preserve them.

Neighborhood Walkability, King Co, WA

When we find those old growth forests,  overgrown parklands, or washed out trails, we should show others where they are and encourage their protection, restoration, and conservation.


EarthCorp Interactive Habitat Map
And when we see something worth seeing or a place that needs attention or a source of information to guide us, we should celebrate them and share them with others.


VOAz Trail Finder Map


Thursday, August 19, 2010

Not So Lonely Crowd

In the not-so-modern world of the last century, one could easily feel isolated even in a crowd. Something has changed since then, however, adding a lifeline one can use to connect across the abyss -- welcome to the Web 2.0.

Connect, respond, interact, all at the click of a button. Haven't heard from your friends lately? Go to Facebook, see what's happening. Have something you want to get off your chest? Go to your blog and spout off. Want to make a difference in a world crisis? In the case of the Pakistan floods, go to CrowdFlower

CrowdFlower Reviewer Form
Reports sent to Ushahidi from cell phones and loaded from twitter are presented to the user for review, categorization and location assignment. The reports are then fed back to Ushahidi for final approval and addition to the online map. All the reports are then viewable by relief workers and the public in an effort to distribute as much information as possible about what is happening on the ground and where help is needed.


Ushahidi for Haiti
Welcome to the brave new world of crowdsourced information and participitory data review. Not so lonely crowd after all.

Wednesday, August 18, 2010

Across the Great Divide

Yesterday I talked about mobile phones and their use in distributing information. While top down approaches will add fuel to the fire of the digital revolution there still needs to be a way to empower those at the furthest corners of the networked earth to fend for themselves.

What if we put the power directly in their hands. By reaching out to young people who are early adopters of new technology, the closing of gaps in access to information can be accelerated. 

Mapping must also meet this challenge, and many more options are becoming available to do so. If the tools are there, what's to stop people everywhere from taking the bull by the horns and determining their own destiny? Sometimes the well must be primed. And yes there is a place for maps to help illuminate the problems and solutions when the water starts flowing.