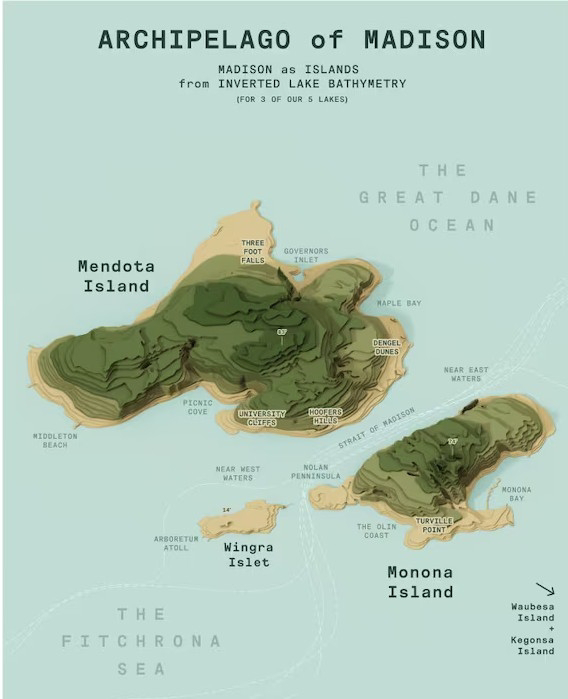
It's been awhile, but I recently came across a mapping approach that serves art as much as data visualization. Steven Kennedy of Madison, Wisconsin, turns map data on its head to alter our perception of the world. For example, he turned Madison lakes bathymetry into elevation, mapping the result as 3D islands in the surrounding county sea.
latlong shopIn another map, Kennedy overlays Madison area bike trails with a diagram of the solar system.
Who thinks of this stuff? On the other hand, have you ever tried to visualize the timeline of biological evolution? You need something familiar to compare it to at more of a human scale. With Kennedy's map, Mars is just a short jaunt along Lake Mendota's shore, whereas Pluto is a good day's ride through the southern Wisconsin countryside to the small village of Mt. Horeb.
Check out the rest of Kennedy's fanciful maps at his Web site: latlong.shop. I think you will agree that data is more than just facts and figures. There is whimsy and art and if you turn your head and squint your eyes, you can see a whole other world.

